Monitor Page Performance in Production

As application developers we spend most of our time in the development environment. If we are just a little bit lucky, though, the applications we develop actually find their way to a production environment. While our day to day attention is rightfully focused in the development environment, the production environment can tell us what our users are experiencing--often highlighting issues before users have a chance to complain. It's great to fix an issue before the issue is raised. Users are happier--and it sure cuts down on paperwork. If you are a visual learner, check out APEX Instant Tips episode 134.
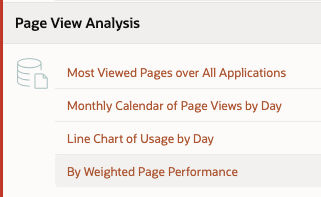
One of my favorite ways to accomplish this is by using the APEX "Weighted Page Performance" report. You click the person with the wrench at the top right of the APEX builder, and then "Monitor Activity."

Then choose "By Weighted Page Performance."
I suggest setting "Since" to "1 Week."
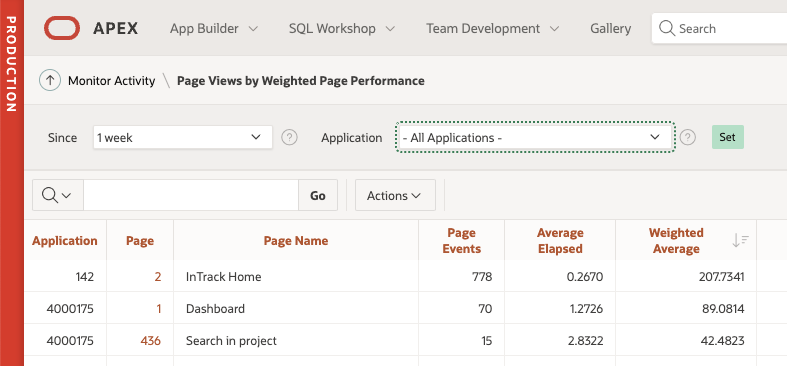
If you are interested in a specific application you can set that as well. The key column here is "Weighted Average." It is the primary order by column, ordered descending for a reason. This column takes into account both how often the page is utilized and how long the page takes to build. You can see the first row above has a fast execution time (Average Elapsed), so there is not much to do there. But the second and third rows are quite slow.
If users rarely visit a page, and it is slow, it may not be that critical to look at. But if a page is just a little slow, but used a LOT, then you may want to look at it soon. A high weighted average indicates two things: the amount of time your users are "wasting" waiting, and the overall impact on the system (how much compute, read/write, etc. the database is using).
Those pages are definitely targets for improvement. Checking this report regularly will give you areas of concern. It's worth adding a performance improvement task to your next development sprint for any slow pages near the top of this list. I love including a message about a code promotion that include "Improved performance of the Assignment Creation page" and getting a response "Oh right! I've been meaning to open a bug about that but you’ve already fixed it!"
Of course, you want to find out about these regularly, so create a report subscription.
Choose Actions > Subscription
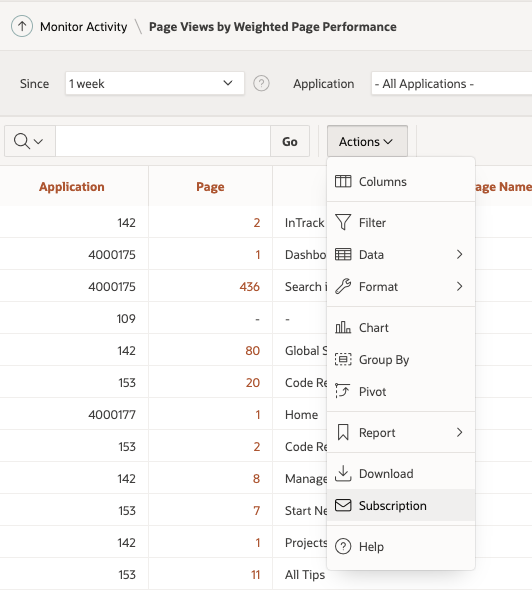
and set up a subscription to send the report to yourself once a week.
Notice I'm doing this in the production environment. If you don't have access to this report in production, ask someone who does to create a subscription with your email address.
And, if you can't do that, create an interactive report in an application you have access to in production. Then subscribe to that report. The report query should be something like this:
select
       application_id,
       page_id,
       application_name,
       page_name,
       count (*)                page_events,
       avg(ELAPSED_TIME)                average_ELAPSED_TIMEsed_time,
       avg(ELAPSED_TIME)*count(*)       weighted_average,
       median(ELAPSED_TIME)             median_ELAPSED_TIMEsed_time,
       median(ELAPSED_TIME)*count(*)    weighted_median,
       (median(ELAPSED_TIME)*count(*)) - (avg(ELAPSED_TIME)*count(*)) median_to_avg_delta,
       max(ELAPSED_TIME)                maximum_ELAPSED_TIMEsed_time,
       min(ELAPSED_TIME)                minimum_ELAPSED_TIMEsed_time,
       max(ELAPSED_TIME) - min(ELAPSED_TIME)    maximum_minimum_delta,
       median(content_length)  median_content_length
from apex_workspace_activity_log l
where
    VIEW_DATE >= (sysdate - nvl(7,1))
group by application_id, page_id, application_name, page_name
Go ahead and modify that query to your liking.
If you've made it this far please do this today and let me know if you did. I'm always pleased to hear that someone actually implemented a suggestion.